Once the voting is closed and the the results have been processed, the platform displays the summary screen from which the various reports can be downloaded.
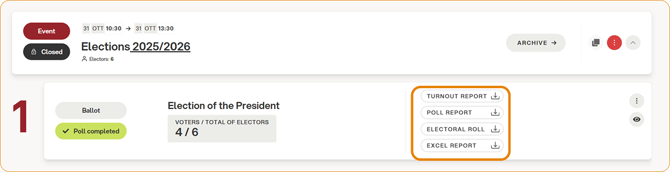
Tip: For a faster consultation, it is recommended to view the Poll Report first, which immediately shows a graphic representation of the results, and subsequently the analytical reports (Electors and Excel) for any further details.
Turnout Report
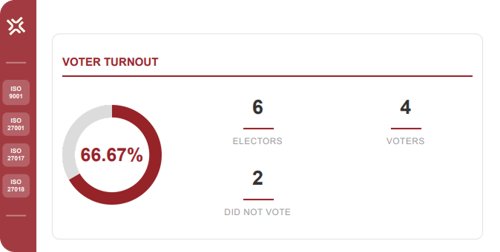
The Turnout Report shows the rate of participation.
The first pages contain a general summary with:
-
The total number of eligible voters;
-
The number of voters and the overall turnout percentage;
-
Any information on accreditation data.
The Turnout Report is the only report available before the voting count begins: using the participation data updated at the time the polls close, the organization can assess whether the required quorum has been reached and decide whether to proceed with the count or, if necessary, repeat the vote.
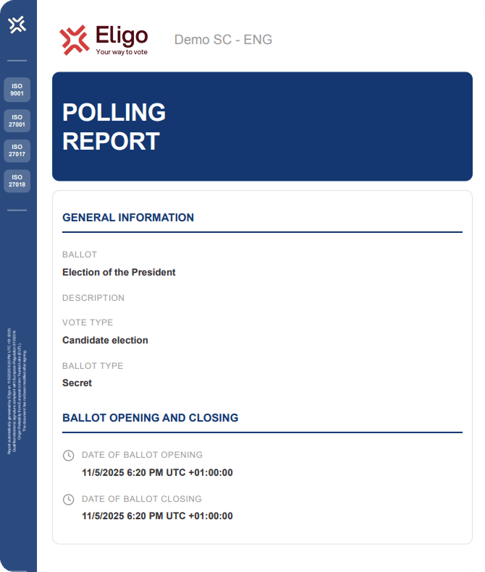
Poll Report
The Poll Report contains the voting results in PDF.
The first page details the characteristics of the ballot, including the date and time the vote opened and closed.
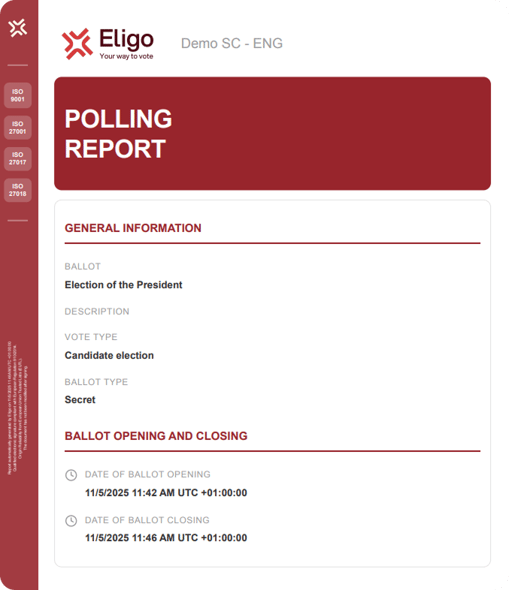
The second page shows the turnout data, which is the same information found in the 'Turnout Report'. The third page provides the preference details, with a separate section for any blank or spoiled ballots.
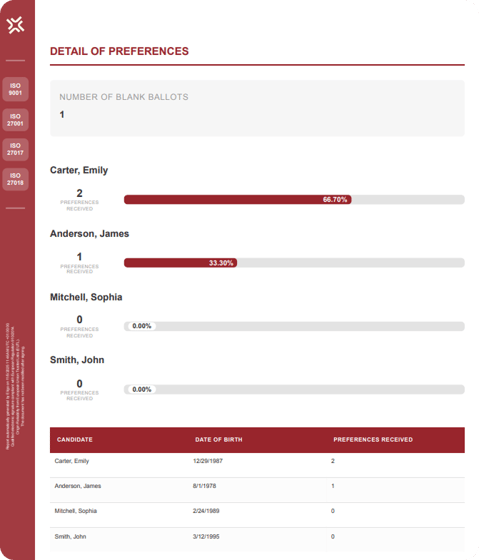
A graph is included showing the candidates' names, the number of votes they received, and the percentage of received votes relative to the total number of votes cast.
Below this, the details of the preferences received by each candidate are available in a table, as the bar graph is only visible for the top ten selected candidates.
In the case of an open vote, a table detailing the individual preferences cast by the voters appears at the bottom of the candidates' preference table.
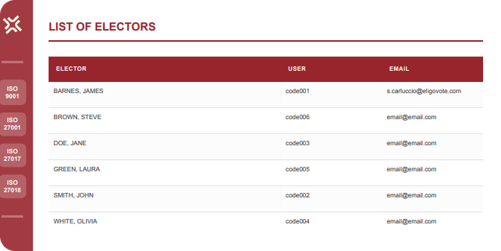
Electoral Roll
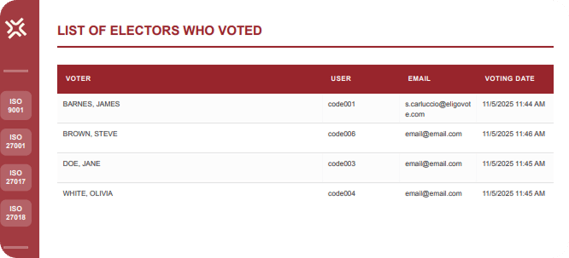
The Electoral Roll lists all eligible voters and the record of those who actually participated in the vote.
The file allows you to verify the following information:
-
The voter's full name (first name and surname);
-
The associated email address, if any;
-
The date and time of the vote, next to the names of those who cast a ballot;
-
Any assigned or received proxies.
This report is useful for administrative checks or for internal archiving purposes.
Should certain fields need to be obscured from the report, it is possible to omit them following an agreement with Eligo's technical team.
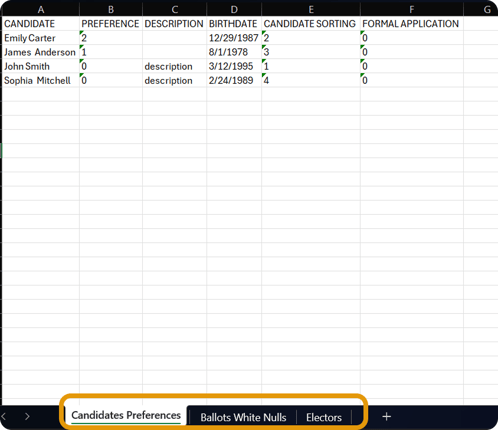
Excel Report
The Excel Report compiles the main scrutiny data into a single file, organized across multiple sheets
-
Candidate Preferences – the votes assigned to each candidate, listed in order of preference;
-
Blank/Spoiled Ballots – a separate count of any blank or spoiled ballots;
-
Voters – the complete list of eligible voters, including information on the date and time of their vote, any assigned proxies, or the weight of the vote.
In the case of an open vote, an additional sheet will contain a table of the individual preferences cast by the voters.
The Excel Report is designed for those who wish to analyze the data in a personalized way, create graphs, or export the information to other tools."
Customizations and Final Notes
Eligo's reports can be customized in several ways:
-
The report's primary and secondary colors automatically match the theme of the voting area at the time the scrutiny results are generated;
-
The organization's logo is always included in the reports (provided it was added during the voting area setup/customization);
-
To further customize the reports with different color codes, please contact the Eligo technical team.
Final Notes
Bar Charts
The bar charts display the same information found in the table below, with the addition of the percentage of total votes received by each candidate. Blank and spoiled ballots are excluded from this percentage (and from the total vote count).
-
Candidate charts are generated only for a maximum of ten candidates; beyond ten, only the table is shown directly.
-
List charts are generated only if there are up to five lists. Beyond five lists, only the table is shown directly.
Truncations:
-
For ballots with more than 1000 candidates, only candidates who have received at least one preference are shown. The same rule applies to list ballots where the total number of candidates across all lists exceeds 1000.
-
All candidates, regardless of the number of preferences received, will be included in the Report Excel file.
-
If all candidates on a ballot have received at least one preference, the reports will still be truncated after 5000 candidates.